
Your annual report took months to put together. It has impact numbers your board signed off, and your homepage shows the biggest ones in large type. Then a funder, a journalist or a partner reads one of those figures and asks the obvious question. What exactly does that count?
If the answer sits on the same screen, the figure works for you. The funder can repeat it in a board paper, the journalist quotes it with the right year, and nobody has to email you to check. If the answer is three clicks away inside a PDF, the number reads like a claim.
Each figure on a foundation or NGO website needs four things beside it: what it counts, its year, its source and a link to the report. Below is how the best foundations in the world handle each one, and how I set them out in the homepage redesign I proposed for the Mo Dewji Foundation, using the foundation’s own figures from its 2025 Impact Report.
Put each number beside what it counts
The label under a number should say what was counted, in the same words your report uses. If the report says patients treated, the homepage should say patients treated. A bigger, vaguer phrase makes a careful reader wonder what the real count was.
charity: water shows “water projects funded” on its homepage, and a short note explains the count: “This number represents all water projects funded by charity: water, including completed projects and those under construction.” A reader now knows that some of those projects are still being built, and nobody can say later that the figure hid it.
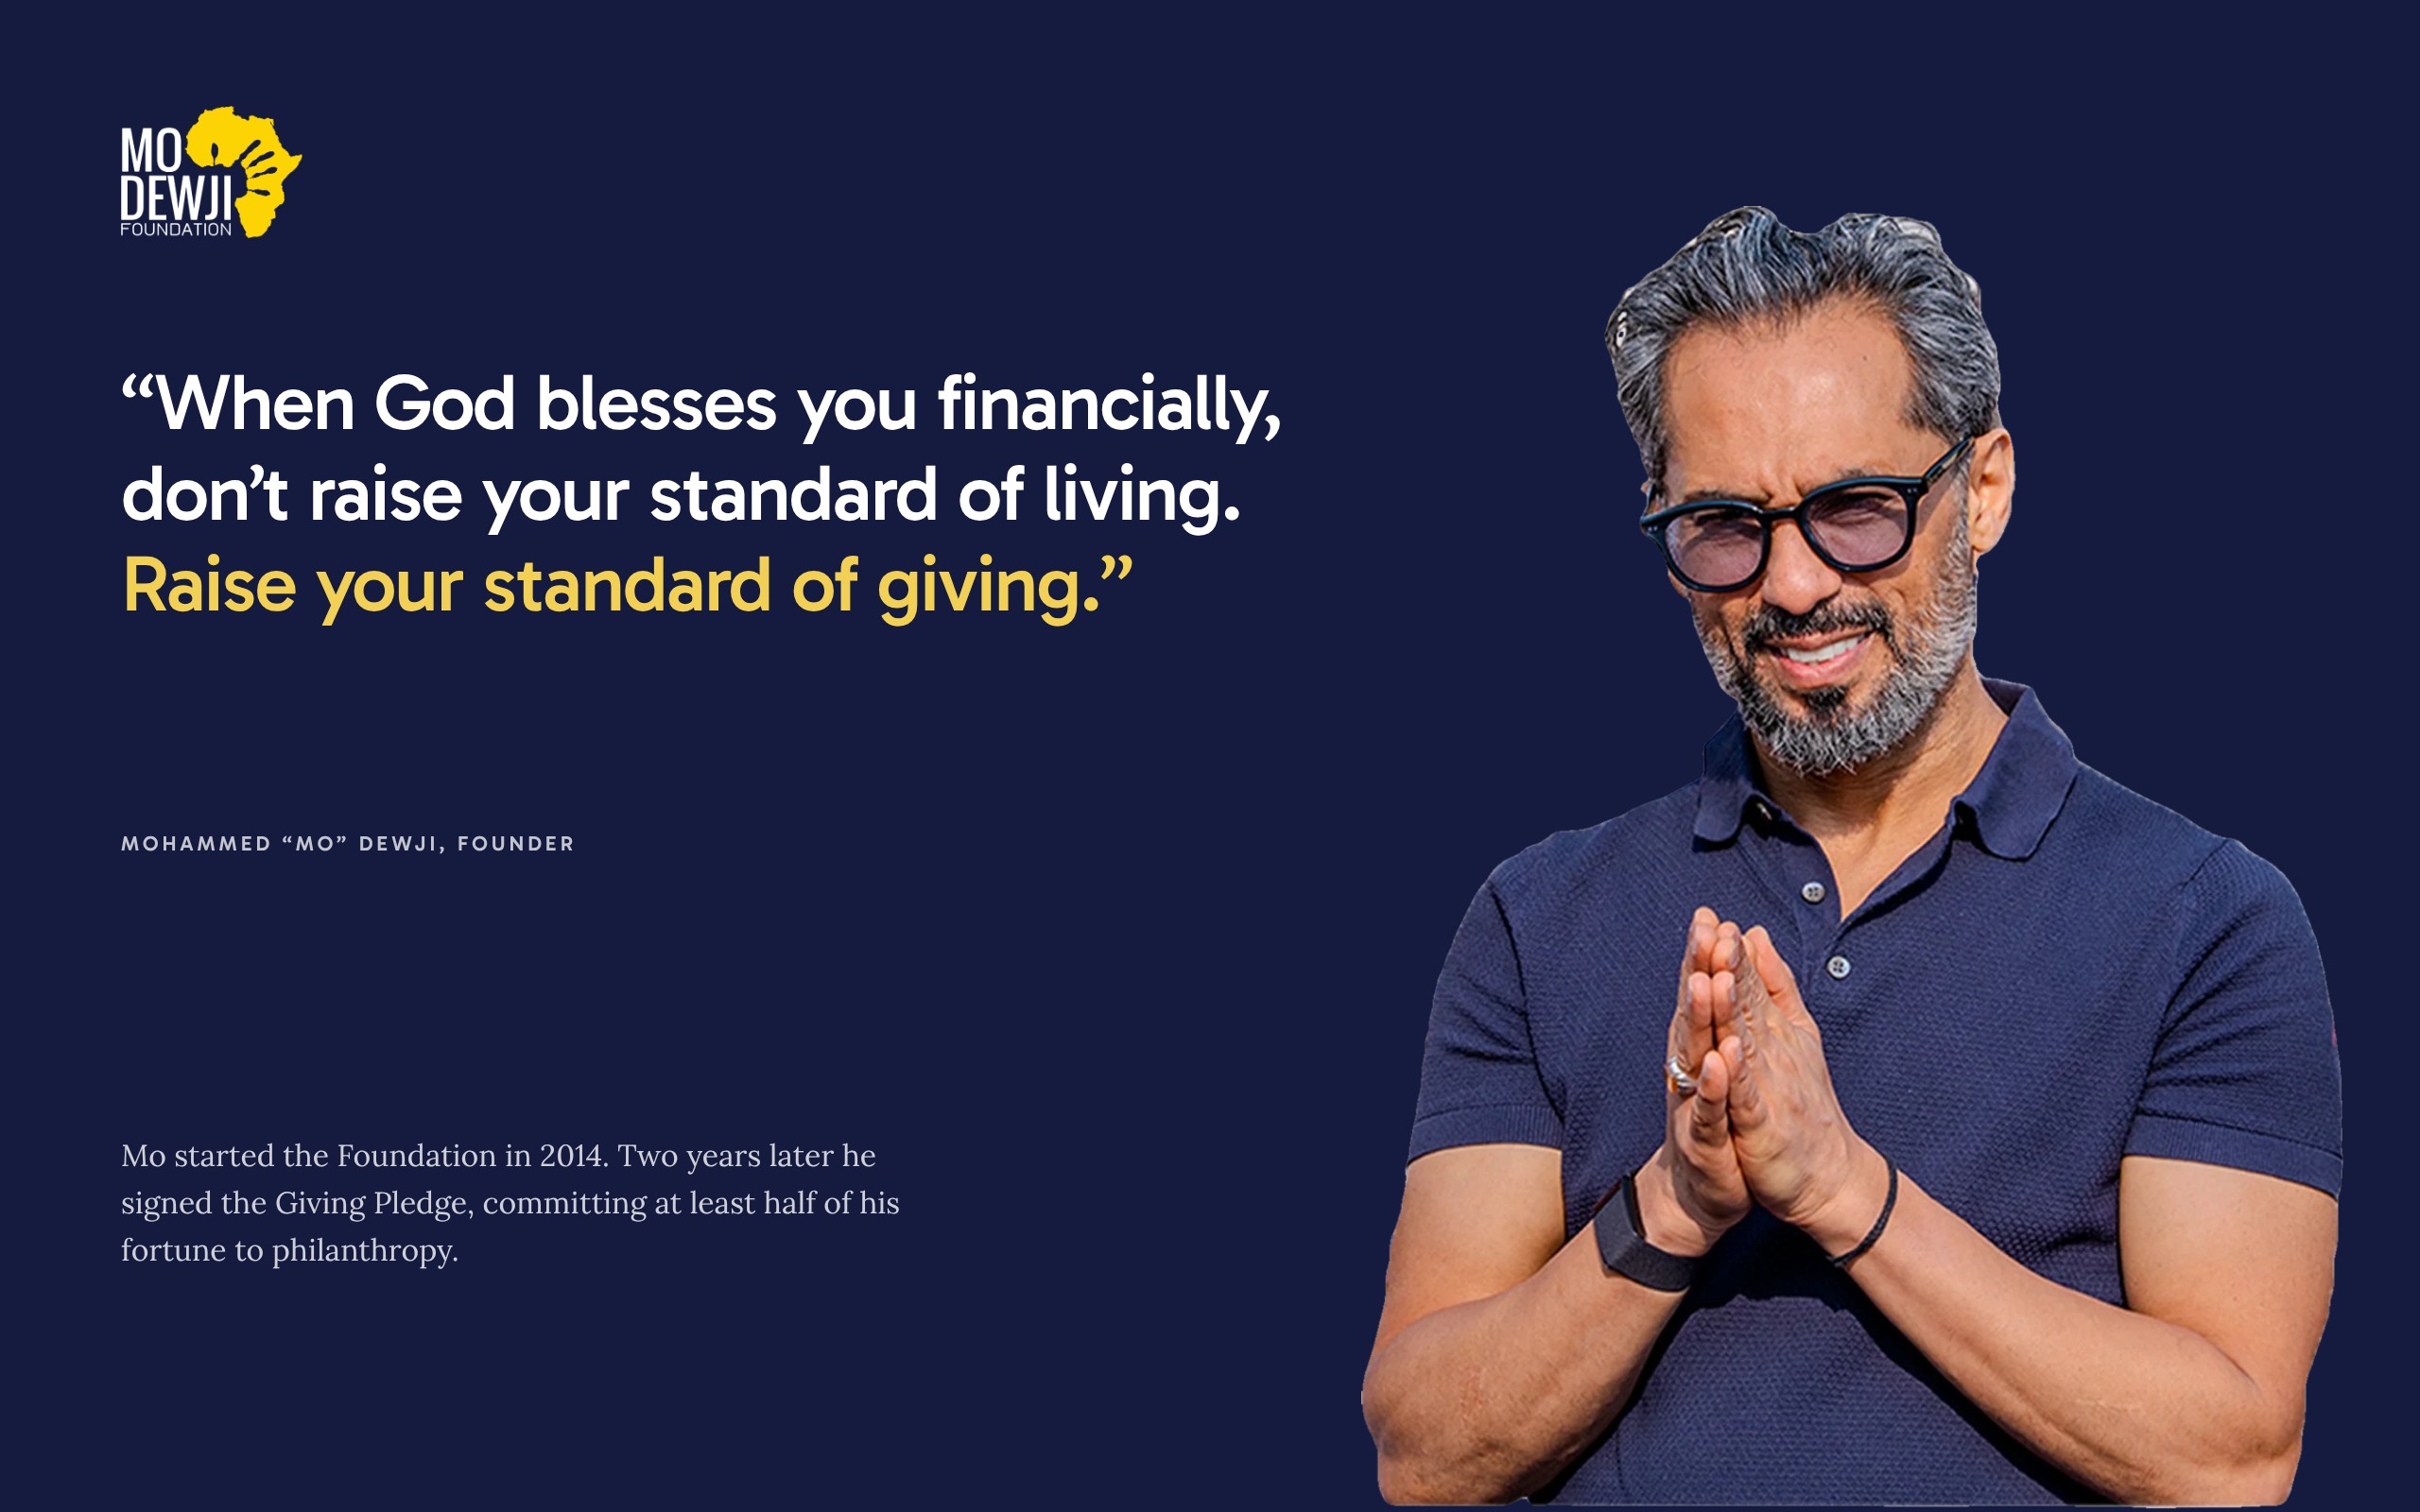
The Mo Dewji Foundation does the same for its best-known education figure. Its Mo Scholars Program page gives a 96% post-graduation success rate, measured “in employment and self-employment”. The reader knows what success means.
On the foundation’s current homepage, three figures sit in their own row under the three programme cards: 400+ Scholarships Awarded, 126,160+ Patients Treated and 33,200+ Lives Impacted with Wells. In the redesign I proposed, each programme gets one result inside its own band, beside the text about that programme. The education band reads “96% of graduates in employment or self-employment”, next to the sentence that says what the Mo Scholars Program pays for. A reader learns what the programme gives and what it achieved in the same place.

Give the year or the span
A total since you started and a result from last year are two different numbers. Say which one each figure is, and keep the two kinds apart on the page.
CAMFED, which supports girls’ education in Tanzania and five other African countries, gives the span on its main figure: children supported to go to school between 1993 and 2025. The Mastercard Foundation writes the start year into the label itself, “Youth-in-Work since 2017”.
The Mo Dewji Foundation’s 2025 Impact Report sets 2024 and 2025 side by side. The eye camps treated 35,689 patients in 2024 and 49,041 in 2025. Eye surgeries rose from 2,333 to 3,049. A reader sees the size of each year, and whether the work is growing, without any extra words.
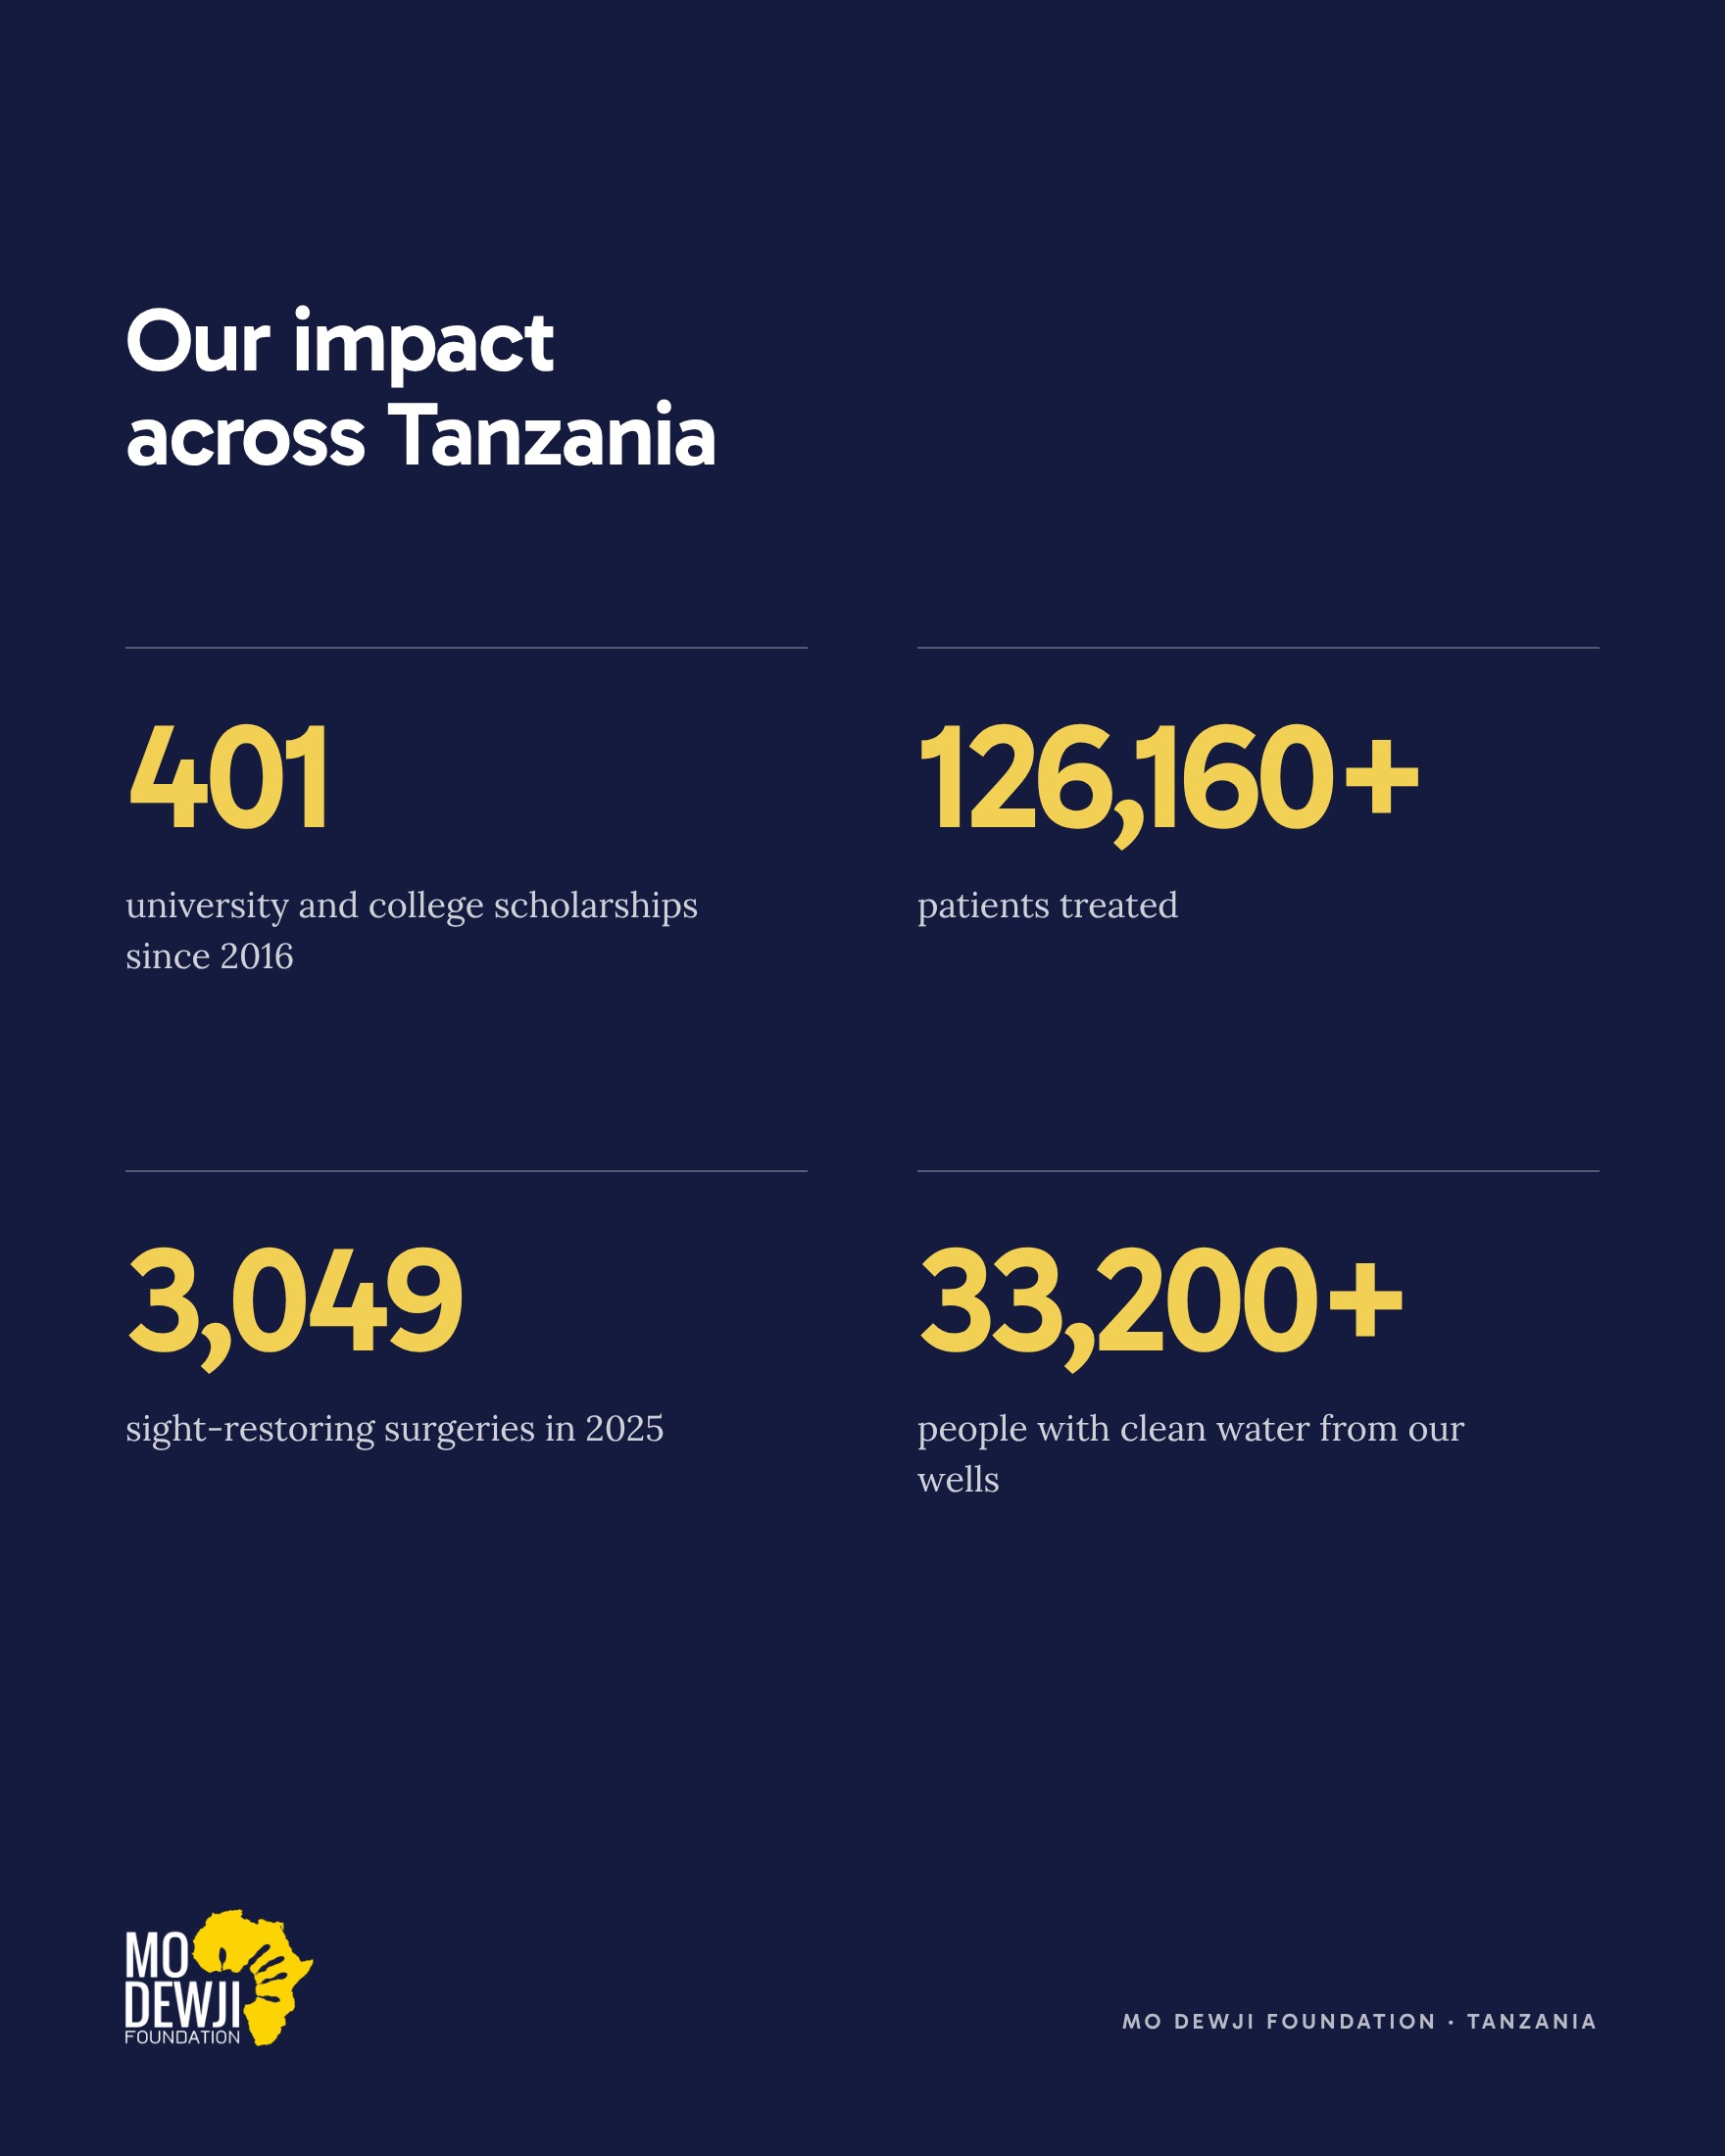
In the redesign I proposed, the year sits in the label wherever the source gives one: “3,049 sight-restoring surgeries in 2025” and “87% surgery success rate in 2025”. The 401 scholarships carry “since 2016”, the year the Mo Scholars Program began. The figure of 126,160+ patients treated has no year, because the foundation’s homepage gives none. When your source gives no span, link the figure to the page it came from, and add the span when the next report states it.
Name the source beside the figure
A figure with a named source can be checked, and a figure that can be checked is easier to believe. The source can be one short line under the figures, such as “From our 2025 Impact Report”.
Say who did the counting when it was someone else. charity: water says its count of people served is “as reported by our implementing partners”. That short phrase tells a funder where the number comes from.
A benchmark gives a figure its meaning. The 2025 report gives the eye camps’ surgical success rate as 87% and explains the World Health Organization (WHO) benchmark beside it: vision of 6/18 or better in 80% of cases. A reader who has never heard of 6/18 still understands that 87 is above 80.
In the redesign, the health band reads 87%, then “surgery success rate in 2025, above the WHO benchmark of 80%”. The section “What changed in 2025” opens with a line that names the 2025 Impact Report before it gives its three figures.
Keep the report one click away
Some readers want the full method behind a figure. Give them the report from the same screen, and from the top of the homepage in the weeks after it comes out.
The redesign I proposed opens with a thin banner, “Our 2025 Impact Report is now online”, and a Read It button. Further down, “What changed in 2025” ends with a Read the 2025 Report button. A partner who came for the report finds it before scrolling, and again next to the results.
GiveDirectly shows the number of academic studies on its programmes with a link to the research, and keeps its financials in the menu. The Tony Elumelu Foundation keeps its impact reports together on one page, and the Mo Dewji Foundation’s publications page holds both its 2024 and 2025 reports.
Think about the phone as well. The foundation’s 2025 report is a PDF of about 5 MB. A short web page with the main figures, with the PDF linked under it, lets a reader on mobile data see the results first and download the full report only if they need it.
Show the people behind the numbers
Figures are easier to believe when a real person stands near them, with a name, a place and the programme that reached them.
Against Malaria Foundation says it adds photos and video of each bed net distribution, so a donor can see where the nets went. charity: water says it proves each project it funds “complete with GPS coordinates and photos”.
The Mo Dewji Foundation’s homepage already quotes people from its programmes. In the redesign I proposed, “Voices from our programs” shows two of them, each with a portrait, a place and a programme. Maria Sileta, from Malika in Mtwara, speaks about an eye camp in her community. Abraham Ipini, a ward councillor in Unyamikumbi, Singida, speaks about a well that had not worked for more than 13 years. Under the quotes, a yellow section headed “Hear from the people behind the numbers” offers scholar stories and eye camp results by email.

Use the same figure on every page
A funder may read your homepage, a programme page, your report and a news article in one sitting. If the same result has two different numbers, they will ask which one is right, and the doubt spreads to your other figures.
Keep one fact sheet with each figure, its label, its year and its source. When a new report comes out, update the website from that sheet and change every page in the same week. charity: water says each of its homepage numbers “is dynamic and updates as we receive new information from our partners in the field.” If yours change once a year, put the year under them.
When two of your own sources differ, choose one and say which. The Mo Dewji Foundation’s water page says its SaWa bags reach an estimated 7,250 people, and the 2025 Impact Report says 8,700. The redesign uses 8,700 and names the 2025 report above it.
A footnote needs the same care. If one of your figures has an asterisk, put its note on the same screen, with what the figure counts and the years it covers.
Every figure in the redesign
These are the figures on the Mo Dewji Foundation homepage redesign I proposed, in the order a visitor meets them.
- 817,800+ at the top of the first screen, the figure the foundation’s homepage gives for lives impacted. The redesign labels it “lives impacted across Tanzania since 2014”, the year the foundation began.
- 96% in the education band, “of graduates in employment or self-employment”.
- 87% in the health band, the eye surgery success rate in 2025, against the WHO benchmark of 80%.
- 49 in the water band, the wells the 2025 report counts as operating.
- Four figures under the map: 401 scholarships, 126,160+ patients treated, 3,049 sight-restoring surgeries in 2025 and 33,200+ people with clean water from the foundation’s wells.
- Three results in “What changed in 2025”: 5,817 women seen through the foundation’s women’s health work, 228 children supported with spina bifida and hydrocephalus, and 8,700 people with safe water storage at home.
Each programme result appears once, beside the words about the programme it measures. Every figure comes from the foundation’s website or its 2025 Impact Report, and none was rounded up. You can see them all in place in the redesign I proposed for the Mo Dewji Foundation, section by section. The rest of the page is in NGO website design in Tanzania that people trust.
Check your impact numbers one by one
- The label uses the same words as your report.
- The year or the span is in the label, or right under it.
- Totals since you started and results for one year are labelled differently.
- The source is named in one short line.
- A benchmark or last year’s figure is given where one exists.
- The report is one click away, with a short web summary for phones.
- Any asterisk has its note on the same screen.
- The same result has the same number on every page and in your press pack.
- Each figure sits beside the programme it measures.
- A real person, named with permission, stands near the figures.
Short answers on impact figures
How do you show impact on a website?
Put each figure beside a label that says what it counts, the year or span it covers and its source. Place it next to the text about the programme it measures, link the full report from the same screen, and add a named person from the programme nearby.
Where should impact numbers go on a homepage?
Your main figure can sit on the first screen. Programme results work best inside each programme’s section, beside the text about that programme, instead of in a separate row. A link to the full report should be one click from both.
Should we round our impact figures?
Use the figure your report uses, with the same plus sign or rounding. If the report says 3,049 surgeries, write 3,049. A precise number with its year reads as something that was counted.
Should our impact report be a PDF or a web page?
Both, if you can. A short web page with the main figures loads quickly on a phone and can be found in search. The PDF, linked from that page, keeps the full method for funders who want it.
What is the difference between outputs and outcomes on an impact page?
Outputs count what you did, such as patients treated or scholarships awarded. Outcomes show what changed, such as a surgical success rate or graduates in work. Show both, and label each one clearly so readers do not mix them up.